| www.ethanwiner.com - since 1997 |
Understanding Peak-Reading Meters
by Ethan Winer
This article first appeared in the April 1981 issue of Recording-engineer/producer magazine.
Peak reading meters, popular in Europe for years, are just now coming into greater favor in America, and for good reason. The main purpose for having a VU meter is obviously to monitor signal levels going to a tape recorder, reverb unit, or some other level-sensitive device, to help optimize the signal to noise ratio of the audio sent to the device. Too much level will produce distortion, and too little results in the inherent noise of the medium becoming a problem. Unfortunately, a conventional VU meter responds to the average level of the program material and not to the peaks; yet it is these momentary bursts of higher level that become distorted first.
You may be thinking that since VU stands for Volume Units, the real purpose of a VU meter is to indicate how loud something sounds. I won't dispute that, but to really do the job correctly, you would first need to measure the true RMS level of the program, and then follow that with an equalizer set to produce the Fletcher-Munson auditory response curves. That would be a true volume indicator. In fact, this is the basis for the A-weighting curve used to measure sound-pressure levels. RMS and average levels are generally pretty similar - both employ an averaging process to arrive at the displayed level - but RMS indication is the only way to determine the true "volume power" of an audio signal. This is the method of level detection that is used in products made by dbx, and is probably one of the reasons for their success.
Getting back to peak levels in music, we all know that when recording an electric bass with heavy limiting on it, there is no problem if you regularly run levels into the red. The limiter will remove any brief transients that occur when the string is plucked, and the level will stay fairly constant. On the other hand, a snare drum, wood block, or claves must always be recorded at what appear to be conservative levels, to allow for the VU meter's sluggish response. The pointer simply cannot move fast enough to keep up with the dynamics of the music; a rim shot can come and go before the poor meter has even made it halfway up the scale. The main feature in a peak-reading meter circuit, therefore, is some type of memory that can remember how loud that rim shot really was, and hold the voltage to the meter constant for the half second or so the meter requires to respond. Utilizing a circuit that does this, and interfacing this circuit with the meters that you already have, is probably the most inexpensive route. However, if you are planning to buy new meters anyway, there is an even slicker alternative you can take, which is explained later.
One other important drawback to the common VU meter is the limited range that can be displayed on its scale. Standard markings go from -20 to +3, completely hiding low-level material and, at the other extreme, pinned solidly in the red before the tape is really saturated. Again, if I may complement dbx, the meters in their limiters use a linear scale that shows a range of 60 dB. in nice even steps. Of course, when the range gets too large it becomes difficult to discern changes as small as a decibel or so, but I find great appeal in a wide-ranging and linear scale marking.
The circuit required to perform this miracle is called a logarithmic converter. In the version presented here I have chosen to limit the converter's range to 50 dB., although this can easily be varied. Such a range was chosen not only to improve resolution and readability, but also because of the wide range of voltmeter types available with divisions already marked from zero to 10. You should be careful, though, to select a meter that requires less than 10 mA. of drive current. It is not difficult to remove the glass face and carefully white-out or paint over the existing numbers. Each remaining division mark will represent an increment of 5 dB., and new numbers can be applied with dry transfers indicating -40, +20, or whatever is wanted. Actually, -35 to +15 seems to be optimum if your tape recorder operating level is 12 dB below 3% total harmonic distortion. (In other words, if +12 is clipping, +15 will still be on scale to show that you blew it.)
One of the great things about building your own equipment is that you can incorporate any options you want, and skip what you don't. One possibility that immediately comes to mind is to place an equalizer in the path of the meter driver. This duplicates the response of a tape deck's built-in preemphasis curve. It's usually not a real problem unless you do a lot of recording at 7-1/2 IPS, but at that speed you must have it if you want to see what's really going on to the tape. Another possibility is an adjustable decay time, or even a peak-hold switch. In this mode, you could play a tape unattended, and when you return the meters will show the highest level that was reached. Otherwise, with the values shown, the attack and release times will conform to the standards established by the BBC. Even if you don't want to build a peak-detector circuit, it is a good idea to put an isolating amplifier between the output of your console or tape recorder and its meters. In the December 1980 issue of R-e/p this point was well taken by Gordon Kapes, who observed the relatively high levels of distortion that a VU meter can add to the line across which it is connected.
A totally different approach to metering is the LED or bar segment meters found on many of the newer consoles. Also, there are systems for simultaneously displaying many channels on a TV monitor screen. Both of these methods are extremely convenient to use, when it is important to really see all of your channels at one time. National Semiconductor makes a pair of chips - the LM3914 and LM3915 - which contain all of the circuitry necessary for a 10-segment display. These chips can also be cascaded to provide even more steps if desired. The 3914 is linear responding, and is intended for voltmeter applications. The 3915, however, is logarithmic and provides increments of 3 dB. which is much more useful for audio applications.
There's little point in going into detail here, when everything you could possibly need to know about the LM3915 is published in the National Semiconductor Linear Data Book. This book contains a wealth of information not only on National ICs, but also shows many circuits and application tips. Even better than the Data Book, however, is the company's Linear Applications Handbook, in which great pains have been taken to provide clear and accurate circuit descriptions. The tone is conversational, there is a minimum of math, and best of all, the book is absolutely free! (That is if you can convince the local National rep that you are a potential user of their product, which shouldn't be too difficult.)
Another excellent and free book in the National Semiconductor library is the Audio/Radio Handbook. Dealing exclusively with audio components, many useful circuits are shown for phono preamps, FET switching circuits, phase shifters, and the like. In fact, many of the circuits in this article were abstracted from the standard building blocks given in the Linear Applications Handbook. I'll also mention my gratitude to Bill Eppler, the smartest person I know - and perhaps the best engineer in the world - for his kind and valuable guidance in the realization of these circuits.
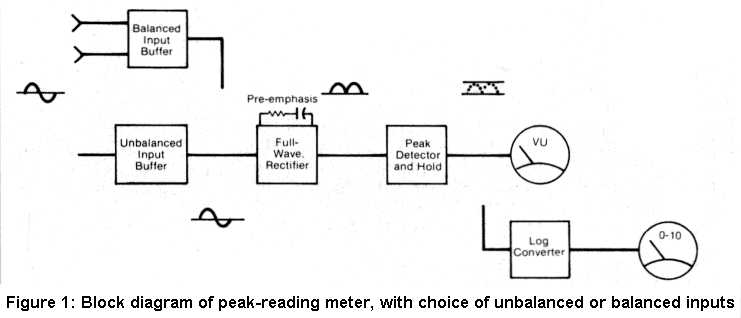
Returning to the options, the "building block" approach is shown first in Figure 1. This illustrates how each stage in the chain uses only one or two op-amps, and performs a separate and isolated function. You may choose between balanced and unbalanced inputs, EQ may be incorporated or omitted, and either log or linear response can be selected. Also, you can adjust the sensitivity of the circuits to accommodate the zero-VU point in your system. The log circuit is definitely trickier to implement, but once you get it set up properly it is more accurate than the associated mechanical meter.
THE INPUT BUFFER
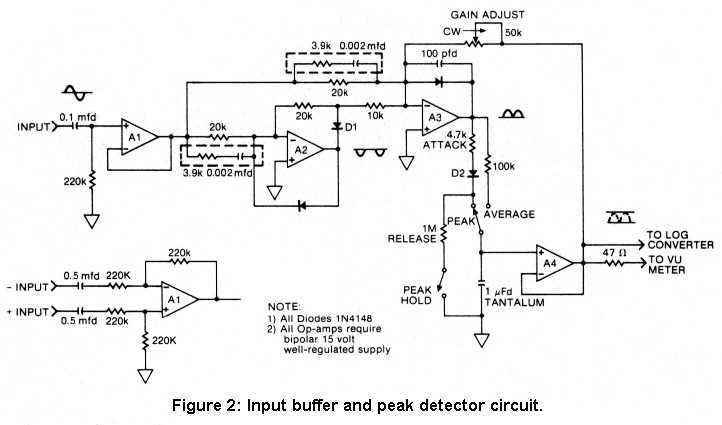
We'll begin our look at the circuits required by starting at the input to the chain. Pertinent waveforms are shown on the schematic to help visualize what's happening where, and the main signal flow is shown with heavy lines. Referring to Figure 2, IC amplifier A1 is used as a buffer to provide a low source impedance to the following stages. This is particularly important if the preemphasis network (shown in outline) is utilized. If a balanced input is needed, the alternate circuit is suitable. If the balanced input is fed from a single-ended source, ground the negative input and apply the signal to the positive input.
In order to obtain maximum common mode rejection, or freedom from outside interference, the 220K resistors should be matched as closely as possible. Five percent resistors are sufficient only when there is no history of hum or RF problems. Otherwise, use either 1% tolerance or, if you have access to a good digital ohmmeter, you can select matched pairs from your supply bin. As I've mentioned in other articles, carbon-film resistors are more stable with temperature and over time than conventional carbon types, and they also have lower noise levels. The two resistors connected to the negative input should be matched as closely as possible; likewise, the two at the positive input. (It doesn't matter, however, if the two pairs are slightly different in value.)
THE PEAK DETECTOR
Amplifiers A2 and A3 comprise a full-wave rectifier used to convert the negative portions of the waveform, as well as the positive, into positive-going only. This makes it possible to monitor the input voltage in both directions at the same time, greatly simplifying our task. Ignoring the preemphasis network for the moment, the signal appearing at the output of A1 is sent to two different routes. The signal sent to A2 is half-wave rectified by the action of diode D1, which passes only one polarity of the signal. A2 is used in the inverting mode so the output goes negative for positive-going inputs, but that doesn't matter at this point. The negative half-cycles continue through the 10k resistor to the inverting amplifier A3, where they are combined with the non-inverting complete waveform from the input buffer. Notice that this signal is combined using a 20K resistor, and it is here that an interesting thing happens. Any positive signal coming through the 20K resistor is combined with a negative version of itself at twice the level - thereby not only canceling it, but also overriding the signal until the negative version dominates. For negative-going inputs A2 remains idle, allowing the signal through the 20K resistor to reach A3 without interference, at which point all negative voltages are inverted again to positive.
Contrary to popular belief, inverting amplifiers were not invented by engineers who got bored with non-inverting amplifiers; each format has it's advantages. Non-inverting amplifiers have the highest impedance, while inverting amps make better mixers. The pre-emphasis networks go in parallel with the 20K resistors, as shown in the schematic, and increase the gain at high frequencies. The values given in the diagram will yield a response similar to the NAB standard pre-emphasis used for tape decks operating at 7-1/2 IPS.
The signal at the output of A3 is now ready to be measured by the peak detecting circuit. As the voltage rises, current flows through the 2.2K attack resistor and diode D2, and places a charge on the 1 uF. capacitor. As the waveform continues its cycle and starts to return to zero, the one-way action of the diode prevents the capacitor from being discharged, and the voltage is held for a time determined by the 1M release resistor. An FET input op-amp is essential for A4 if the peak-hold option will be used, and the whole circuit could be nicely accommodated by a quad op-amp such as the TL074. Also, the 1 uF. capacitor should be Tantalum to ensure a long hold time.
I should mention that while I was testing the prototype, I observed the voltage fall at about 1 dB. per minute when it should have been holding. It turned out that a leaky diode was causing minute currents to flow back out of the capacitor. This problem could also be caused by the FET at the op-amp's input, or by a defect in the capacitor itself. Once the diode was replaced, it was impossible to observe any drift, even after 5 minutes.
When average rather than peak response is desired, the diode and attack and release resistors are bypassed and replaced with a single resistor. This is easily accomplished with a switch, as shown in Figure 2. The final output that drives the meter is taken from A4 through a 47 ohm resistor. This particular resistor is not needed if the circuit is used with the log converter shown in Figure 3, but it is always a good idea when connecting an op-amp to the outside world to protect the op-amp from an accidental short circuit. The 50K trimpot closes a feedback loop around the detector circuit, and is used to adjust the gain of the system.
THE LOGARITHMIC CONVERTOR
The log converter is an interesting circuit that also has many applications outside of audio. To help understand the concept, you could look at a piece of log graph paper, the kind used to display frequency response curves. The scale is continuously compressed as you follow it from left to right, much like the scale on a slide rule (remember those?) So if, for example, the first three inches contain the range from 20 Hz. to 200 Hz. - or one decade - the next three inches represents the decade from 200 Hz. to 2 KHz. More total cycles are contained in the second group, but they are compressed to the same "value" as the first decade. The same principle applies to decibels and the way we hear. This is why on a normal VU meter in order to read in decibels, the scale is compressed on the left to accommodate the linear response inherent in this type of meter mechanism.
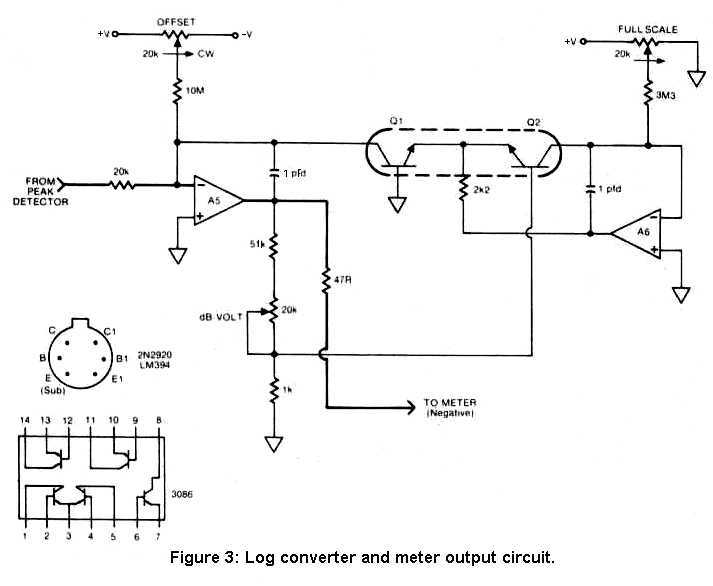
A circuit that compresses the output voltage of the peak detector is shown in Figure 3. This circuit takes advantage of a well-known property of the ordinary junction transistor: namely, that the voltage which appears between the base and the emitter is related logarithmically to the current flowing through the device's collector. (Logarithms occur in nature!) By pumping a current through the transistor and then measuring the resultant voltage across the base-emitter junction, we have accomplished the goal of logarithmic conversion.
Referring to Figure 3, the voltage from the detector is applied to op-amp A5 through a 20K input resistor. Since we are applying a positive voltage to the negative input, the output of A5 begins to go negative. This applies a voltage to the base of Q2 which, in turn, pulls down on the emitter of Q1. Q2 is required both to offset the initial 0.6 Volt base-emitter drop in Q1, and also to counteract any inaccuracies due to temperature. This is because the temperature of the logging transistor is also a factor in the operation of the circuit. By adding Q2 to the feedback loop, the other half of a matched pair, any changes in Q1 due to temperature will be exactly cancelled. In fact, the change in a transistor's base-emitter voltage with temperature is also well known and constant over an extremely wide range. Many electronic thermometers are built using a transistor or diode as the sensing element, and can cover a range of several hundred degrees.
A reference current through Q2 is required to get things going, and is supplied from the 3.3M resistor and the full-scale adjust trimmer. The offset-corrected voltage appears at the base of Q2, though its level is extremely low. A greatly amplified version of this same voltage is available at the output of A5, and it is here that we connect the meter. Again, note the addition of the 47 ohm isolating resistor. The 1 pF. capacitors are for high-frequency stability, since the addition of the transistors to the loop increases the apparent gain of the op-amps.
Because the circuit has the potential for dealing with extremely low-level inputs (log converters can be built with an input range of 100 dB. or so), offsets and transistor matching become quite critical. In our version, -35 dB. is as low as we go, but even at 20 or 30 mV, an offset adjustment is required. In order to ensure a high degree of transistor matching, a dual transistor is the obvious choice. The National books suggest the 2N2920, or their own LM394, but RCA and National also make the 3086 transistor array, which costs much less. There are many other suitable NPN arrays, although high Beta (forward gain) is an important requirement.
These dual transistors or arrays are like simple integrated circuits, except that only two or, in the case of the 3086, five transistors are made at one time. The advantage in doing this is that both transistors are guaranteed to be not only from the same original silicon wafer, but they're also next door neighbors, so to speak. If you do use the 3086, it is important to connect pin 13 the substrate to the negative power supply. Also, two of the transistors already have their emitters connected together, and these are the two you should use.
It is important to note that the output voltage to the meter is of a negative polarity, so you must reverse the meter wires. This is so easy to do that there is really no point in adding another op-amp inverter stage just to make the output go positive.
ADJUSTING THE LOG CONVERTOR
After you are sure that there are no mistakes in the wiring, apply
power to the circuit and adjust the offset trimmer to be at the middle of its travel. Do
this by placing a voltmeter between ground and the wiper, and adjust for zero Volts. Next,
place the other two trimmers in their center positions. Apply a 1 KHz. signal at a level
that you want to be full scale - in our case +15 dB. - and adjust the full-scale 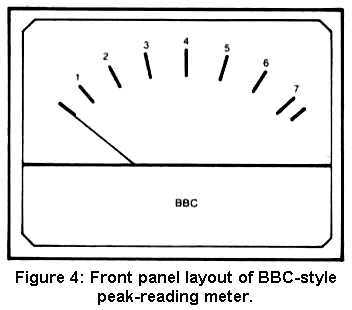 trimmer for an output of -10 Volts. Reduce the input voltage in 10
dB. steps and observe that the output falls by approximately 2 Volts each time. Adjust the
dB./Volt trimmer to make the steps exactly 2 Volts, though you will probably have
to go back and re-adjust the full-scale trimmer once or twice. When the steps are
accurate and the full scale is correct, apply an input at -35 dB. and adjust the offset
trimmer to give exactly zero Volts output. Again, you may have to go around a few times
with the trimmers, but it really isn't too difficult to set up properly.
trimmer for an output of -10 Volts. Reduce the input voltage in 10
dB. steps and observe that the output falls by approximately 2 Volts each time. Adjust the
dB./Volt trimmer to make the steps exactly 2 Volts, though you will probably have
to go back and re-adjust the full-scale trimmer once or twice. When the steps are
accurate and the full scale is correct, apply an input at -35 dB. and adjust the offset
trimmer to give exactly zero Volts output. Again, you may have to go around a few times
with the trimmers, but it really isn't too difficult to set up properly.
Since we are not encompassing a 100 dB. range, the adjustments are not too sensitive to changes in temperature. If you do observe any warm up drift, it is advisable to use a thermistor in place of the 1K resistor. The correct one to use here is the Q81 manufactured by TelLabs in Manchester, NH. It is in all basic respects a resistor, except that its resistance changes with temperature in a controlled and useful manner. In this case, it is used to compensate for the way temperature affects the logging transistors.
Using peak meters may seem strange at first, but once you know what you are looking at you'll never again have to guess when setting levels. If you are using a normal VU meter with the peak-detecting circuit, you should adjust the gain trimmer so zero is at a slightly elevated level on the tape - say 3 dB. below clipping - since you now have the capability to monitor the peaks as they approach saturation.
The British Broadcasting Company's format for peak-program meter scales, shown in Figure 4, offers a display range of slightly more than 24 dB. on a logarithmic scale. If you prefer to utilize this scale design, simply substitute a 0-5 Volt meter for the 10-Volt type, and reduce the value of the gain trimmer to 10K. The rest is taken care of during calibration, although you will need to label the steps to 4 dB. increments.
Entire contents of this web site Copyright © 1997- by Ethan Winer. All rights reserved.