| www.ethanwiner.com - since 1997 |
Rigid Fiberglass Density Tests
by Ethan Winer
This article describes a series of tests comparing the absorption of different densities of rigid fiberglass, and also the effect of adding an FRK facing.
Rigid fiberglass is available in a number of densities, as are rigid rock wool and rigid mineral wool which are very similar. I'm most familiar with Owens-Corning rigid fiberglass, and that brand is commonly available in three densities. Their most popular product is 703, which has a density of 3 pounds per cubic foot (pcf) or 45 kilograms per cubic meter. The density of 701 (1.5 pcf) is half that of 703, and 705 (6 pcf) is twice as dense as 703. Both 703 and 705 are also available in an FRK version, which has a metalized paper bonded to one side of the fiberglass. FRK stands for Foil Reinforced Kraft paper.
Although 701 is not often used for acoustic purposes, I included it in my tests hoping to identify a trend in absorption as the density changed. Had I tested only 703 and 705 the results might be less conclusive. Unfortunately, 701 is not available with an FRK facing because it's very flimsy. So I had my fiberglass supplier create 701 FRK manually by gluing sheets of metalized paper to raw 701 panels. A visual inspection confirmed the paper was exactly the same as Owens-Corning bonds to their rigid fiberglass, and that it was attached properly.
Although acoustic data is readily available for these products, that data is not useful when assessing absorption at very low frequencies. The standard way to measure absorption is in the reverb room of an acoustics lab. However, very few acoustic labs are certified or able to test accurately below 100 Hz. Indeed, I've never seen a manufacturer's published data list absorption below 125 Hz. When selecting materials for building bass traps, the performance below 100 Hz matters at least as much as at higher bass frequencies. So I had to devise a new method to assess the absorption of these materials at very low frequencies. I don't need absolute absorption values given in Sabins, but I do need to know which material absorbs more than another.
My solution was to use the ETF software (full-range 5-second Sweep mode) in a normal size room (about 16 by 11-1/2 by 8 feet). This room has a mode distribution that's not terrible and - just as important - it's in a quiet location, is available whenever I need it, and is empty with no absorbing furnishings such as couches or book shelves. Unlike the coarse third octave results you get from an acoustics lab for their standard reverb room tests, ETF can resolve decay bandwidth to finer than 1 Hz. Looking at the various graph results below you can clearly identify each room mode and see its individual decay time. The downside is the only frequencies that can be tested in this particular room are those that resonate. So while I can measure the change in decay time at 35 Hz and 49 Hz and 71 Hz perfectly, I can't test at 60 Hz or other in-between frequencies. To do that I'd need to find another room.
Real acoustic labs control both the temperature and humidity, but that seems unimportant here. Those won't change much between tests and they're less significant at low frequencies. I'm not looking for certified Sabins values anyway, just relative comparisons. There's another big advantage to ETF, at least for testing the effectiveness of different bass absorbers: Besides showing exactly how each mode's decay time is reduced, ETF also shows how the absorption widens the bandwidth (lower Q) of those resonances. In my experience, this feature of bass trapping is at least as important as flattening the low frequency response and reducing modal ringing time. With a wider bandwidth the peaks and nulls are audibly less intrusive - instead of individual bass notes sticking out like a sore thumb, a much broader range is emphasized. This is clearly visible in the graphs that follow.
Note that the tests described here do not give any numbers! All analysis is done visually, looking at how the modal ringing decay time is reduced (the "mountains" come forward over time) at each mode frequency, and also by seeing how the Q of each mode is lowered thereby making the peaks broader.
THE TEST ROOM
The drawing below shows the test room and its dimensions, as well as the "listener" position where the measuring microphone was placed. As per studio designer Wes Lachot, the room was divided at 38% front to back and floor to ceiling as giving the flattest low frequency response. In truth, this probably doesn't matter much for these tests because the focus here is to assess the change in decay time, not obtain the flattest measured response.
Twelve separate tests were performed and care was taken not to move the microphone between tests. One series of six tests compared the three densities with and without the FRK facing using 12 panels each three inches thick. The same tests were then run again using six panels six inches thick because some acousticians have suggested that density may matter less as the panels are made thicker.
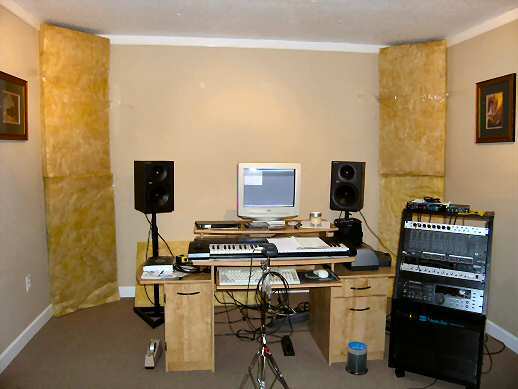
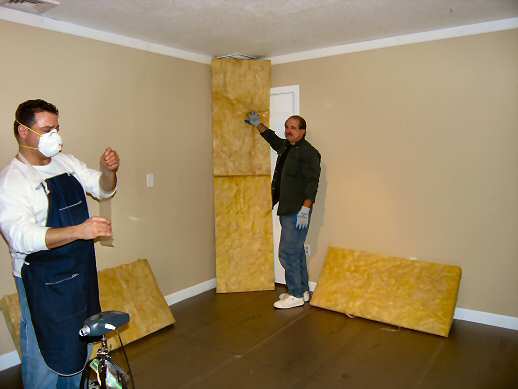
The photos below show how the fiberglass samples were placed in the room, and the adjacent graphs show the change in modal ringing for each set of samples. The two tables are organized so the density increases as you go down the page, with the plain fiberglass on the left and the FRK types on the right. This way you can look from top to bottom to see what happens as density increases, and left to right to see the affect of adding the FRK to a panel of a given density. A graph showing the modal ringing with the room empty is repeated at the top-right of both groups so you can compare without having to repeatedly scroll up and down.
At the bottom of this page are a description and additional photos that show the exact sample placements. After the three combinations of 12 FRK panels were tested, the FRK facing was removed from half the panels to create the six inch thick FRK versions. After that round of tests the FRK was removed from the remaining six panels to create six plain panels six inches thick, and also 12 plain panels three inches thick.
12 PANELS 3 INCHES THICK
 |
|
 |
 |
 |
 |
 |
 |
6 PANELS 6 INCHES THICK
 |
|
 |
 |
 |
 |
 |
 |
ANALYSIS
So what can we learn from these graphs? First, it's evident that for all of the fiberglass types it's better to have twelve thinner panels spread more completely around the room than only six thicker panels covering less total surface area. All of the tests with 12 panels show the ringing decaying faster, and the bandwidth of the modes being wider, when compared to only six panels twice as thick.
For the density comparisons with 12 panels, in each case increasing the density reduced the ringing time and lowered each mode's Q more than the less dense versions. Likewise, in all tests of 12 panels the FRK facing improved absorption from the lowest 41 Hz mode to the 200 Hz upper limit displayed. The tests of six 6-inch thick panels show less of a trend, and in one case - 701 plain versus 701-FRK - the plain version appears a tiny bit better at the 42 Hz mode. The other modes hardly changed at all, but this might be due to covering less total room surface. This also shows that density appears to become less important when the panels are made thicker. However, even with only six 6-inch panels 705-FRK still emerges the clear winner, if only by a small amount at 42 Hz.
Note that what looks like a longer decay at 200 Hz in some of the FRK graphs is not really the case. The peak at 200 Hz is actually at a higher frequency, so its center is off the right edge of the graph. In the Room Empty graph the peak just above 200 Hz is very narrow (high Q). In the 6-inch thick 701-FRK graph the peak is made broader (lower Q) and is also at a slightly lower frequency due to the presence of the absorption. What had been a larger peak hidden past the right edge of the graph, is now more fully on the graph. So the peak is not really worse, it's better.
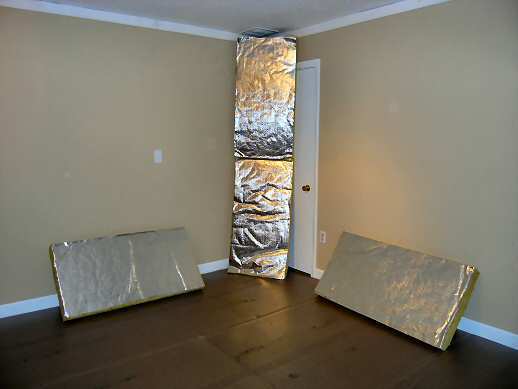
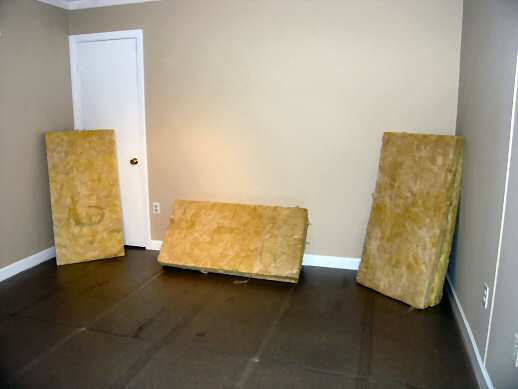
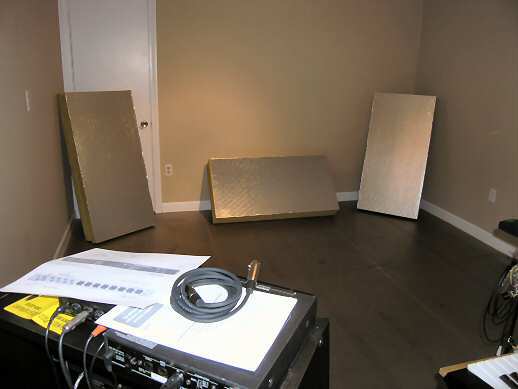
SAMPLE PLACEMENT
For the tests of 12 panels, two were stacked one above the other in each wall-wall corner, and one was placed in the floor-wall corners of the front, rear, left, and right walls. The tests of six panels placed two three-inch panels adjacent with one in front of the other. For the wall-wall corners the upper panel was moved to be in front of the lower panel. For the floor-wall corners two panels were moved away from the side walls to double the thickness of the front and rear floor-wall panels.
 |
 |
 |
 |
 |
 |
|
 |
The Dafabet app https://dafbet-app.in/ in India is a nice choice.
Contents Copyright © 1997- by Ethan Winer and RealTraps, LLC. All rights reserved.